Power BI Dasboard
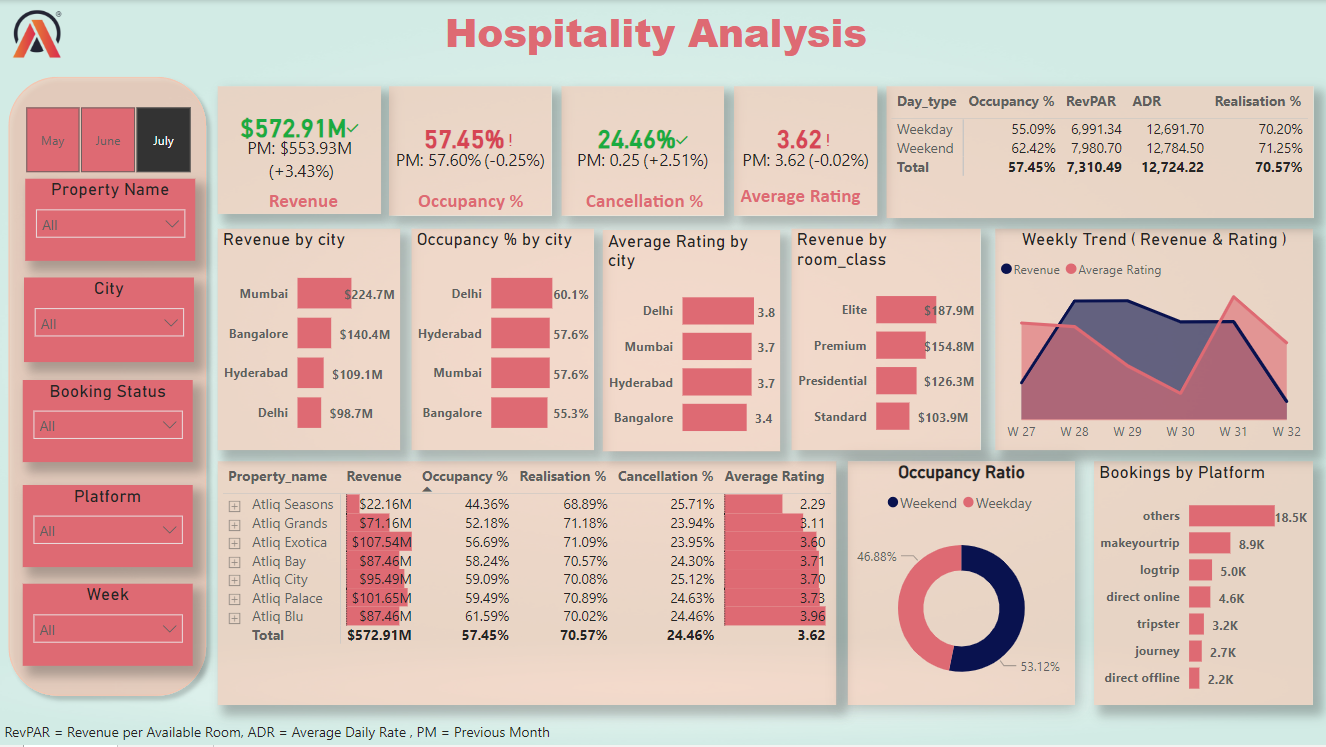
In the Dasboard, we added the different filters we apply on the Dasboard, We can use filters on City, Property, Month, Booking Status, Week etc. We have KPI's indicating Revenue, Occupancy %, Cancellation %, Average Rataing. Also, there Revenue By City, Occupancy By City and Average Rating By City graphs. A Matrix is adding that shows key metrics w.r.t Property Name/ID/City.
We have a table that Shows Day Type w.r.t Occupancy%, RevPAR, ADR, Realisation %. An Area chart showing weekly trend w.r.t Revenue and Average Rating, A donut chart showing Occupancy ratio for weekday and weekend. Finally, a clustered bar chart is added showing booking platforms w.r.t total bookings.