Marketing View
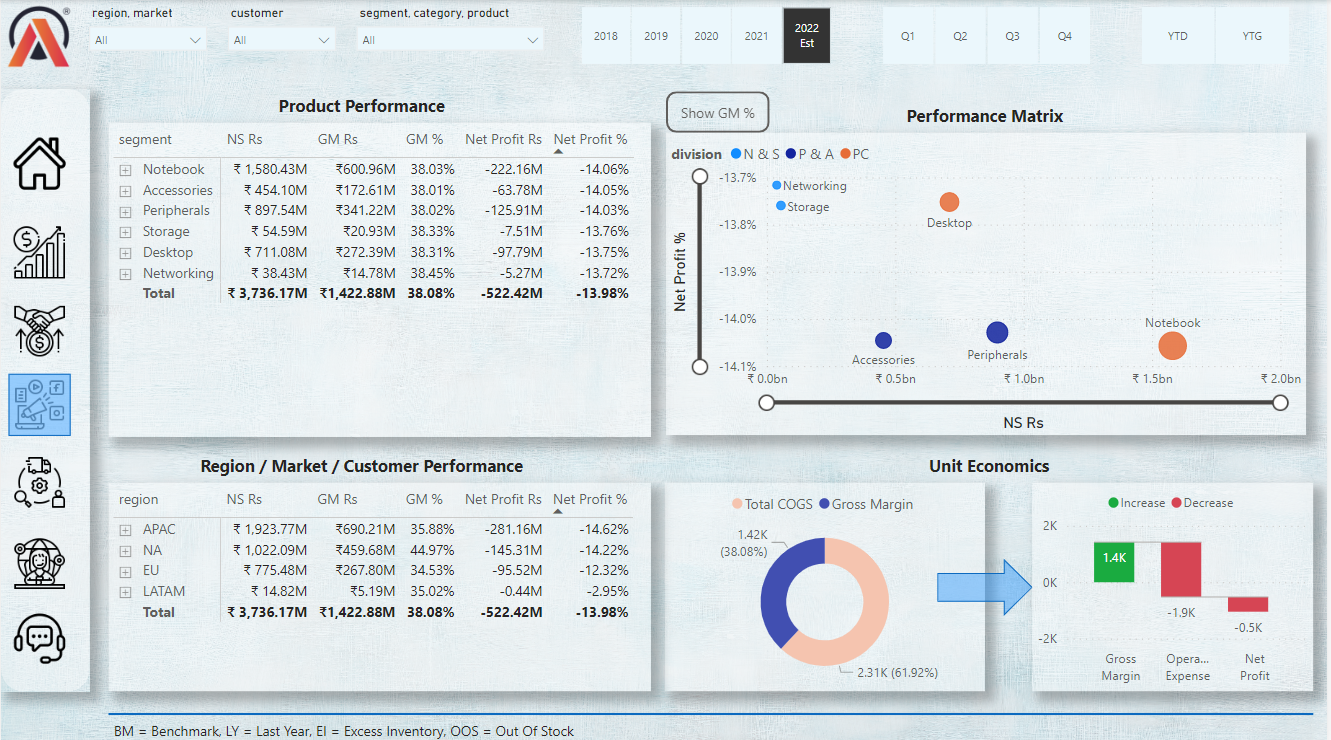
1.In this view we have Product Performance w.r.t Net Sales, Gross Margin, GM %, Net Profit, Net Profit %.
2.And also Region/Market/Customer Performance w.r.t Net Sales, Gross Margin, GM %, Net Profit, Net Profit %.
3.We have Donut Charts showing Gross Margin, Total Cost of Goods.
4.And a Waterfall Chart Showing Gross margin, Operational Expense, Net Profit.
5.We have created a button to show Net Profit%/ Gross Margin % vs Net Sales for Region & Customers .